Understanding the Importance of Temperature Monitoring
As a tech enthusiast, I have always been fascinated by the inner workings of my devices. One of the most critical aspects of system health that I’ve learned to keep a close eye on is temperature. The temperature of a device’s components can provide invaluable insights into its overall performance and stability. That’s why I’ve come to rely on HWMonitor, a powerful software tool that has become an indispensable part of my hardware diagnostics arsenal.
In this in-depth article, I’ll delve into the world of temperature monitoring and explore how HWMonitor can offer crucial diagnostic insights that can help you keep your systems running at their best. We’ll cover the fundamentals of temperature monitoring, the key components to track, and how to interpret the data provided by HWMonitor. By the end of this piece, you’ll have a comprehensive understanding of how to leverage this powerful tool to maintain the health and longevity of your devices.
Unveiling the Fundamentals of Temperature Monitoring
The temperature of a device’s components is a crucial indicator of its overall health and performance. When a component’s temperature rises beyond its optimal operating range, it can lead to a variety of issues, ranging from reduced efficiency to complete failure. This is why temperature monitoring is such an essential part of any comprehensive hardware diagnostics strategy.
But what exactly are we looking for when we monitor temperatures? The key is to understand the critical components within a device and their ideal operating temperatures. In a typical computer system, for example, the central processing unit (CPU), graphics processing unit (GPU), and various other chipsets and storage devices all generate heat as they perform their tasks. By tracking the temperatures of these components, we can identify any potential issues and take proactive measures to address them before they become larger problems.
Leveraging HWMonitor for Comprehensive Temperature Monitoring
This is where HWMonitor comes into play. HWMonitor is a powerful software tool that provides users with a comprehensive overview of their system’s hardware, including detailed temperature readings for a wide range of components. Developed by CPUID, a leading provider of system monitoring and diagnostic tools, HWMonitor has become a go-to solution for tech enthusiasts and professionals alike.
One of the key advantages of HWMonitor is its ability to track temperatures across a diverse range of hardware, including CPUs, GPUs, motherboard chipsets, and even hard drives and solid-state drives (SSDs). This level of detail allows users to gain a deep understanding of their system’s thermal profile, enabling them to identify and address any potential hotspots or areas of concern.
Interpreting Temperature Data with HWMonitor
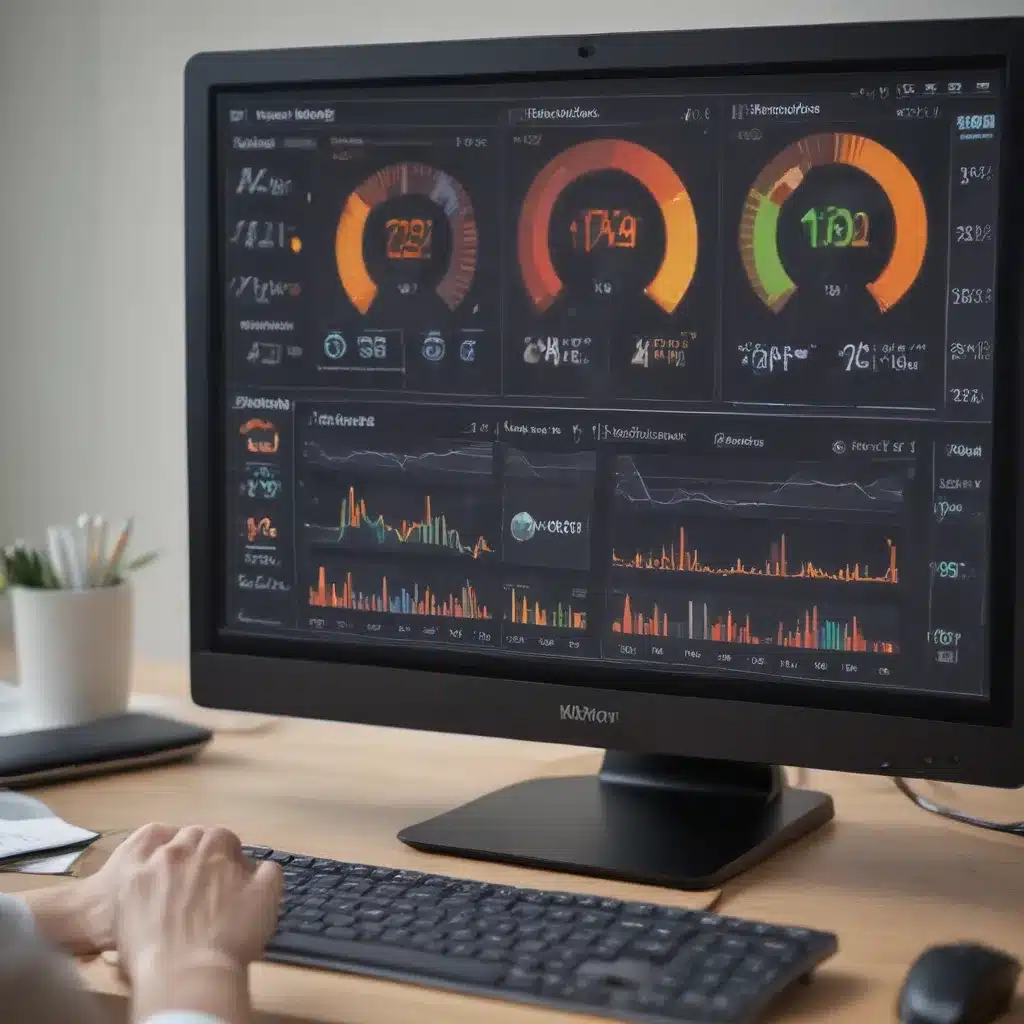
But simply having access to temperature data isn’t enough – we need to know how to interpret it effectively. HWMonitor presents this information in a clear and intuitive manner, making it easy for users to understand the significance of the readings.
One of the first things I look for when analyzing the temperature data from HWMonitor is the baseline or idle temperatures of my system’s components. These readings provide a reference point for the normal operating temperatures of the hardware. By establishing this baseline, I can then monitor for any significant deviations, which could indicate an underlying issue.
For example, if I notice that my CPU temperature is significantly higher than its typical idle temperature, it could be a sign of an issue with the CPU’s cooling system, such as a malfunctioning fan or a buildup of dust in the heatsink. Conversely, if I see that my GPU temperature is consistently higher than expected, it could be an indication of increased workload or a potential problem with the GPU’s cooling solution.
Maintaining Optimal System Temperatures with HWMonitor
Armed with the detailed temperature data provided by HWMonitor, I can then take proactive steps to maintain the optimal operating temperatures of my system’s components. This may involve adjusting fan speeds, optimizing cooling solutions, or even identifying and addressing the root causes of temperature spikes.
One of the most common ways I use HWMonitor to maintain optimal temperatures is by monitoring the effectiveness of my system’s cooling solutions. By tracking the temperatures of key components like the CPU and GPU, I can ensure that the cooling systems are functioning as intended and keeping the hardware within their recommended operating ranges.
If I notice that a component’s temperature is consistently high, I can take steps to improve cooling, such as cleaning out dust buildup, upgrading to a more powerful cooling solution, or even adjusting the fan speeds manually. HWMonitor’s real-time temperature monitoring allows me to see the immediate impact of these changes, helping me fine-tune the cooling setup and maintain optimal system temperatures.
Leveraging Temperature Data for Hardware Diagnostics
But temperature monitoring with HWMonitor goes beyond just maintaining optimal operating conditions. This powerful tool can also be a valuable asset in diagnosing and troubleshooting hardware-related issues.
For example, if I’m experiencing sudden system crashes or performance drops, HWMonitor can help me identify whether overheating is a contributing factor. By analyzing the temperature data, I can pinpoint the specific component or components that are running hotter than normal, and then investigate the underlying cause, such as a failing fan, a thermal paste issue, or even a hardware defect.
In one recent case, I was troubleshooting a persistent system crash issue on my gaming PC. After launching HWMonitor, I noticed that my GPU temperature was spiking to dangerously high levels during gameplay. Further investigation revealed that the GPU’s cooling solution had become compromised, leading to the overheating and subsequent system instability. Armed with this information, I was able to address the issue by replacing the GPU’s cooling system, ultimately resolving the problem and restoring my system’s performance.
Monitoring Temperatures Across a Diverse Hardware Ecosystem
As my technological ecosystem has grown more complex over the years, I’ve come to rely on HWMonitor’s versatility to monitor temperatures across a wide range of devices. From my desktop PC to my laptop, and even my smartphone and various IoT gadgets, HWMonitor has proven to be an invaluable tool for maintaining the health and longevity of my hardware.
One of the standout features of HWMonitor is its ability to track temperatures on a diverse range of hardware platforms. Whether I’m dealing with an Intel or AMD-based CPU, an NVIDIA or AMD GPU, or even a Raspberry Pi single-board computer, HWMonitor has consistently delivered accurate and reliable temperature data, empowering me to make informed decisions about my hardware’s maintenance and upgrades.
Unlocking the Power of Temperature Monitoring with HWMonitor
In conclusion, temperature monitoring is a critical aspect of hardware diagnostics and maintenance, and HWMonitor is a powerful tool that can help you unlock the secrets of your device’s thermal profile. By providing detailed, real-time temperature data for a wide range of components, HWMonitor gives users like myself the insights we need to maintain optimal system performance, identify and address potential issues, and ultimately extend the lifespan of our hardware.
Whether you’re a tech enthusiast, a professional IT administrator, or simply someone who wants to keep their devices running at their best, I highly recommend exploring the capabilities of HWMonitor. By harnessing the power of this remarkable software tool, you’ll be well on your way to mastering the art of temperature monitoring and unlocking the full potential of your hardware.


