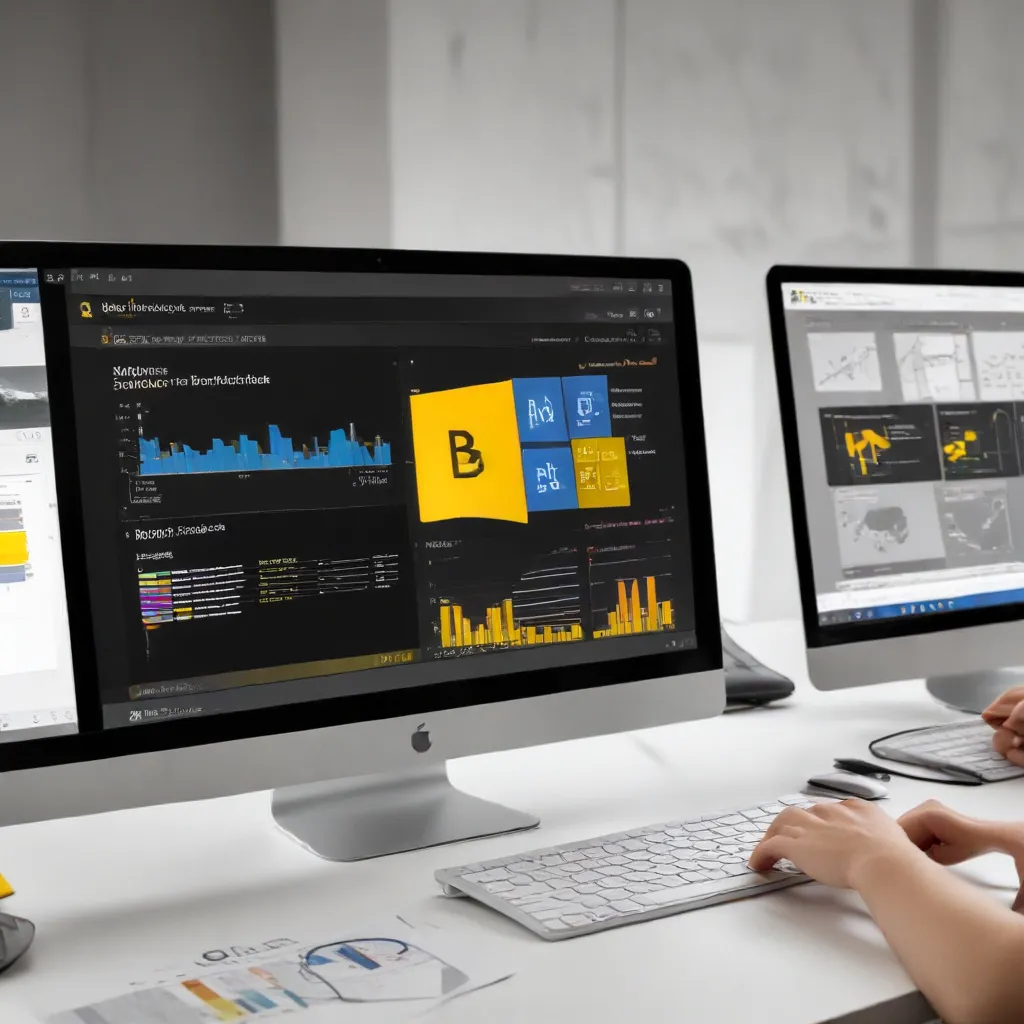
Unlocking the Power of Embedded Analytics
In today’s data-driven business landscape, organizations are constantly seeking innovative ways to leverage their data assets and empower decision-makers with actionable insights. One powerful solution that has gained significant traction is Microsoft Power BI Embedded, a cloud-based platform that allows application developers and independent software vendors (ISVs) to seamlessly integrate stunning and fully interactive visual analytics into their own applications.
Power BI Embedded is an Azure cloud service that enables ISVs and application developers to embed stunning and fully interactive visual analytics elements into their applications. By embedding data visualization within an app, businesses can deliver analytics in the right user context and at the right time, providing their customers or employees with the insights they need to make informed decisions.
Elevating Analytics with R Visuals
One of the latest and most exciting advancements in Power BI Embedded is the introduction of support for R visuals. R visuals not only enhance Power BI Embedded with advanced analytics depth but also offer developers endless visualization flexibility. This integration of R, a popular programming language for statistical computing and data visualization, into the Power BI Embedded platform opens up a world of possibilities for businesses.
Power BI Embedded now supports the integration of R visuals, allowing developers to leverage advanced analytics and custom visualizations to deliver even more insights to their users.
With R visuals, Power BI Embedded users can now incorporate business forecasts, clustering, decision trees, and other sophisticated analytical techniques directly into their embedded reports and dashboards. This enables application users to uncover hidden patterns, identify trends, and make more informed decisions without the need for specialized data science expertise.
Seamless Integration and Deployment
Integrating R visuals into Power BI Embedded reports is a straightforward process, similar to publishing any other embedded report. The key steps include:
-
Create a Report Using Power BI Desktop: Developers can download report examples with R visuals or learn how to author their own reports with R visuals using Power BI Desktop.
-
Provision the Report into Azure Management Portal: The report is then provisioned into the Azure management portal, making it available for embedding.
-
Embed the Report into the Application: Developers can use the Power BI Embedded REST API and JavaScript code to embed the R-enhanced report into their application.
-
Deliver Insights to End-Users: Once the embedded report is set up, application users can seamlessly consume the R-enhanced report as part of their workflow, without requiring any specialized knowledge of Power BI or R.
The consumption of R-enhanced embedded reports is included in the existing Power BI Embedded license and terms of use, ensuring a seamless experience for both developers and end-users.
Boosting Productivity and Decision-Making
The integration of R visuals into Power BI Embedded empowers application developers and ISVs to deliver even more sophisticated and insightful analytics to their users. By leveraging the power of R, they can unlock advanced analytical capabilities, such as predictive modeling, time-series forecasting, and clustering, and present them in a visually compelling and interactive manner.
This integration of R visuals into Power BI Embedded allows developers to deliver advanced analytics and custom visualizations directly within their applications, empowering users to make more informed, data-driven decisions.
For example, a sales application could incorporate R-powered forecasting models to predict future revenue trends, while a customer service application could utilize R-based clustering algorithms to segment customers based on their behavior and preferences. These advanced analytics, seamlessly integrated into the user’s workflow, can provide invaluable insights and drive more informed decision-making.
Enhancing the User Experience
The seamless integration of R visuals into Power BI Embedded also enhances the overall user experience. Application users can now access and interact with these advanced analytical capabilities without the need for specialized data science skills or separate BI tools. This democratization of analytics empowers a wider range of users to explore data, uncover insights, and make data-driven decisions within the context of their everyday workflows.
By integrating R visuals into Power BI Embedded, application developers can deliver advanced analytics and custom visualizations directly to their users, empowering them to make more informed decisions.
Additionally, the embedded nature of the R-enhanced reports ensures that users can access the insights they need without having to navigate away from the application they are already using. This seamless integration reduces the friction often associated with switching between different tools or platforms, leading to a more efficient and user-friendly experience.
Unlocking the Future of Embedded Analytics
The integration of R visuals into Power BI Embedded represents a significant step forward in the evolution of embedded analytics. By combining the advanced analytical capabilities of R with the interactive visualization and cloud-based deployment of Power BI Embedded, application developers and ISVs can now deliver even more powerful and insightful analytics to their users.
As businesses continue to seek ways to leverage their data assets and empower their decision-makers, the integration of R visuals into Power BI Embedded offers a compelling solution. By embedding these advanced analytics directly into their applications, organizations can unlock the full potential of their data and drive more informed, data-driven decision-making across their entire ecosystem.
To learn more about how Power BI Embedded can help your business unlock the power of embedded analytics, visit the IT Fix website and explore the latest insights and resources on business intelligence and data-driven solutions.


